If you have an iPhone and have News notifications enabled, you likely got a notification yesterday with this question: Is it time to ban fireworks? Apple cited this article:
https://www.outsideonline.com/outdoor-adventure/environment/fireworks-environmental-impact/
We’re not here to answer that question exactly. We don’t take a strong stance one way or the other, but we will use data to make some suggestions and nuances. And if you’ve ever asked yourself the same question, here are some interesting nuggets to consider.
What’s the trend of firework usage?
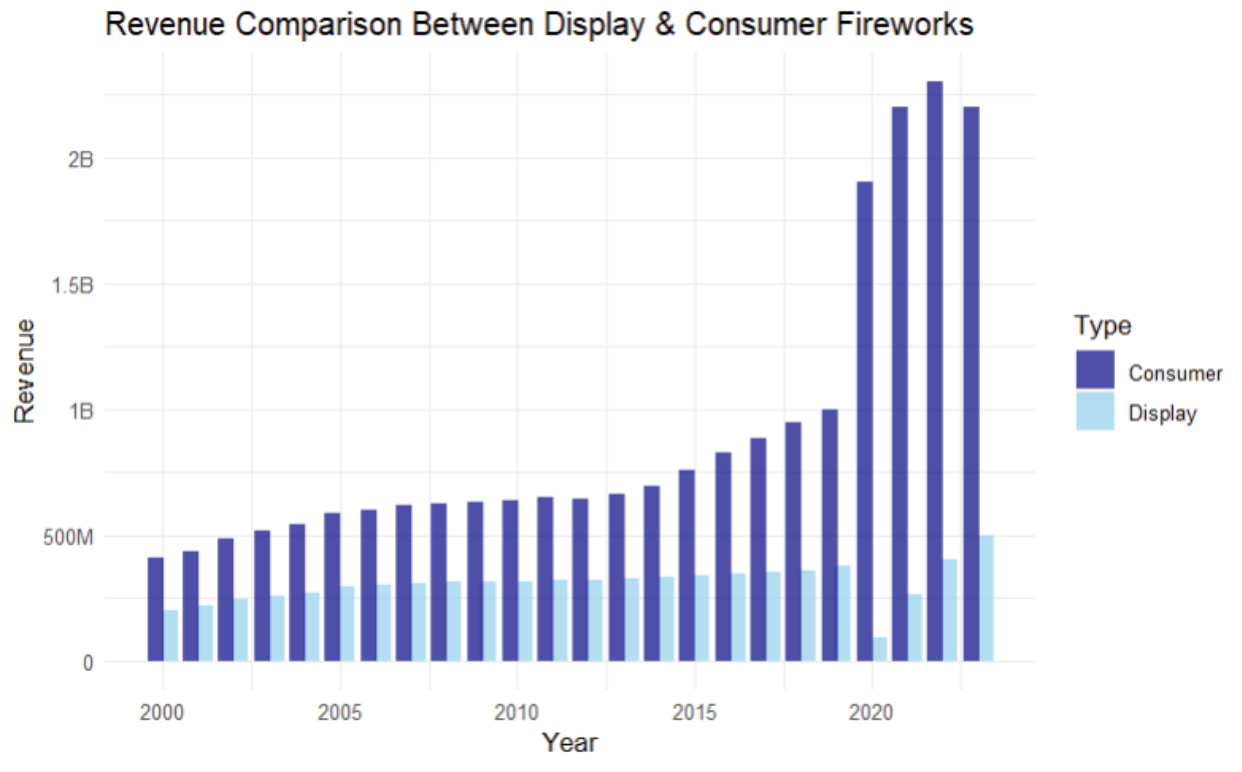
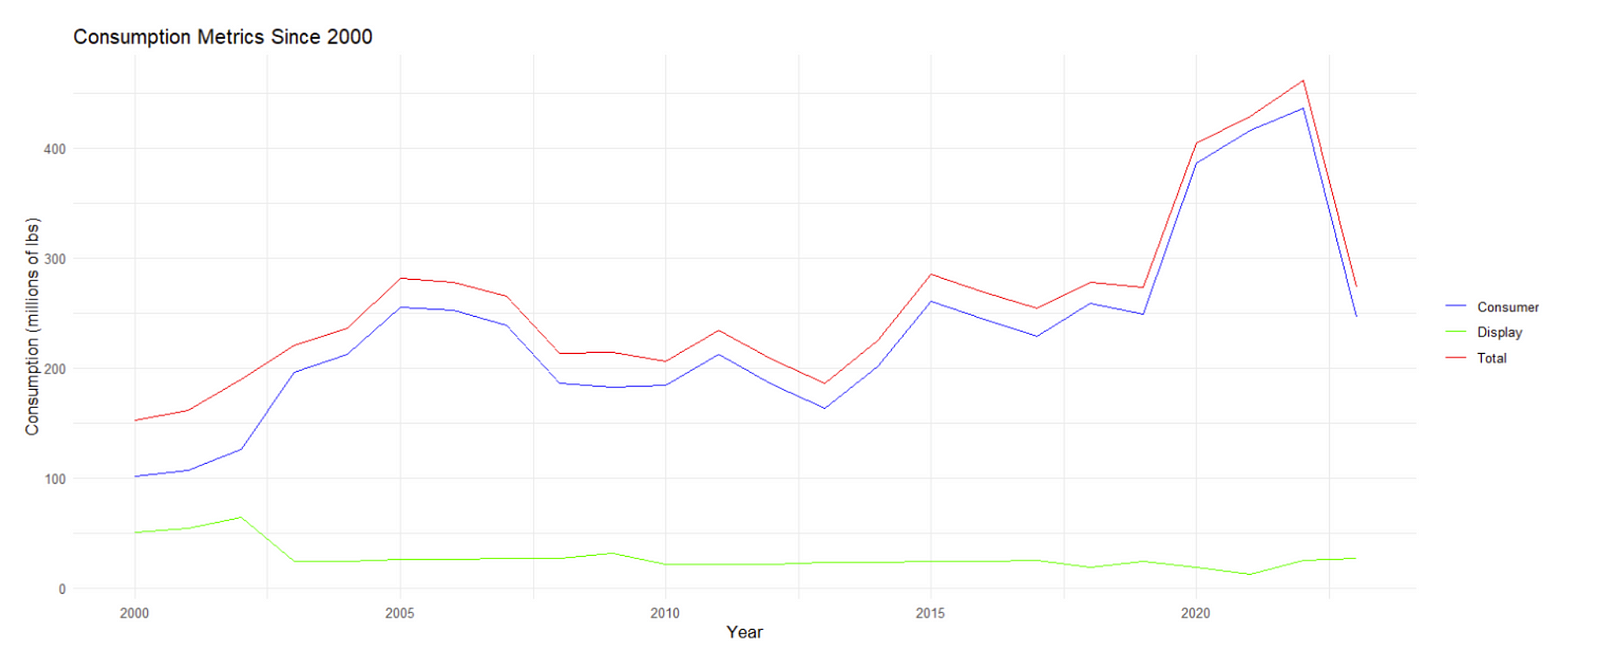
The growth of fireworks has been steady. Then in 2020, Revenue and consumption spiked drastically. Did anything special happen in 2020? I can’t recall.

Obviously the pandemic had a massive impact on… everything. And between increased national park visits and increased fireworks consumption, the data is clear: People want to be outside.
Which States Import the Most per person?

Unsurprisingly, these states have generally lower populations and rural areas. Missouri is actually a bit of an outlier because their population is larger.
Are Fireworks Dangerous?
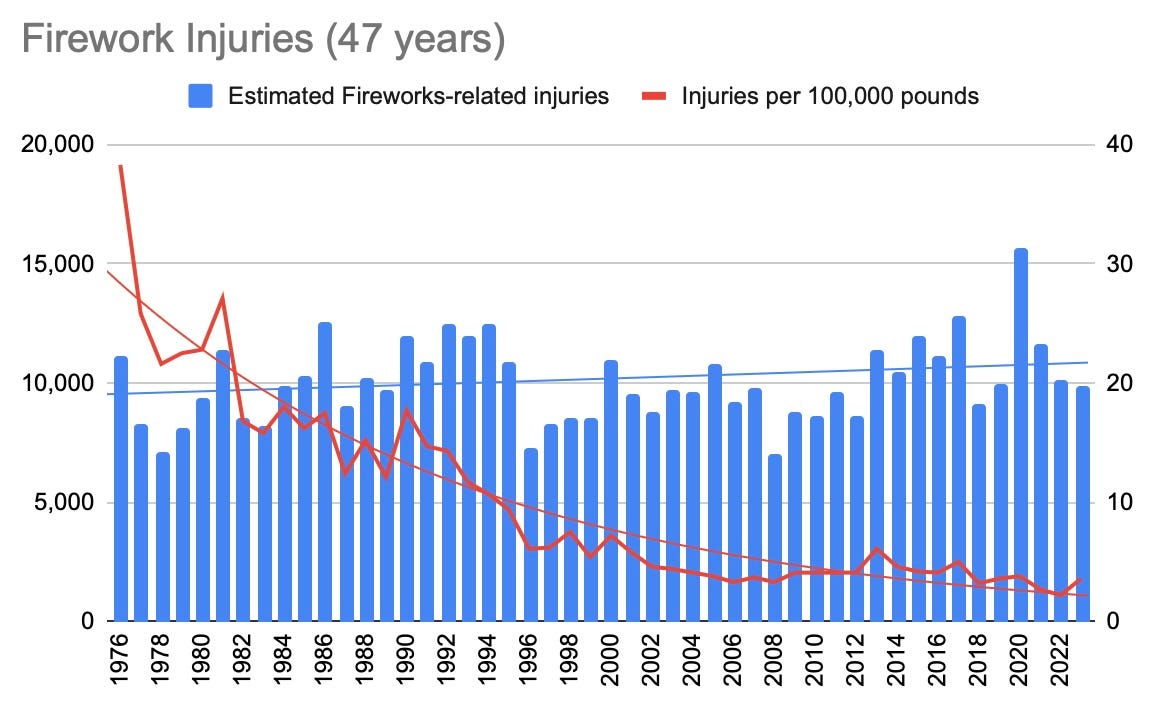
200 years after the signing of the Declaration of Independence (1976), injuries were at their peak. This was a massive celebration and fireworks were promoted heavily as a sign of patriotism. What’s interesting is that there were likely a lot of first-time users in 1976 and in 2020, both of which represented spikes in injuries. But the number of injuries per pounds of fireworks sold has drastically declined since then.
What about recent trends?

You caught me. That first chart was the same data that the American Pyrotechnics Association shares on their website, and they clearly have an agenda. They want you to see that massive drop in 1976. But if you look at the last 20 years, the trend is similar. The total number of injuries is increasing and the number of injuries per pound of fireworks sold is decreasing, albeit in a much less drastic fashion.
What about even less time?
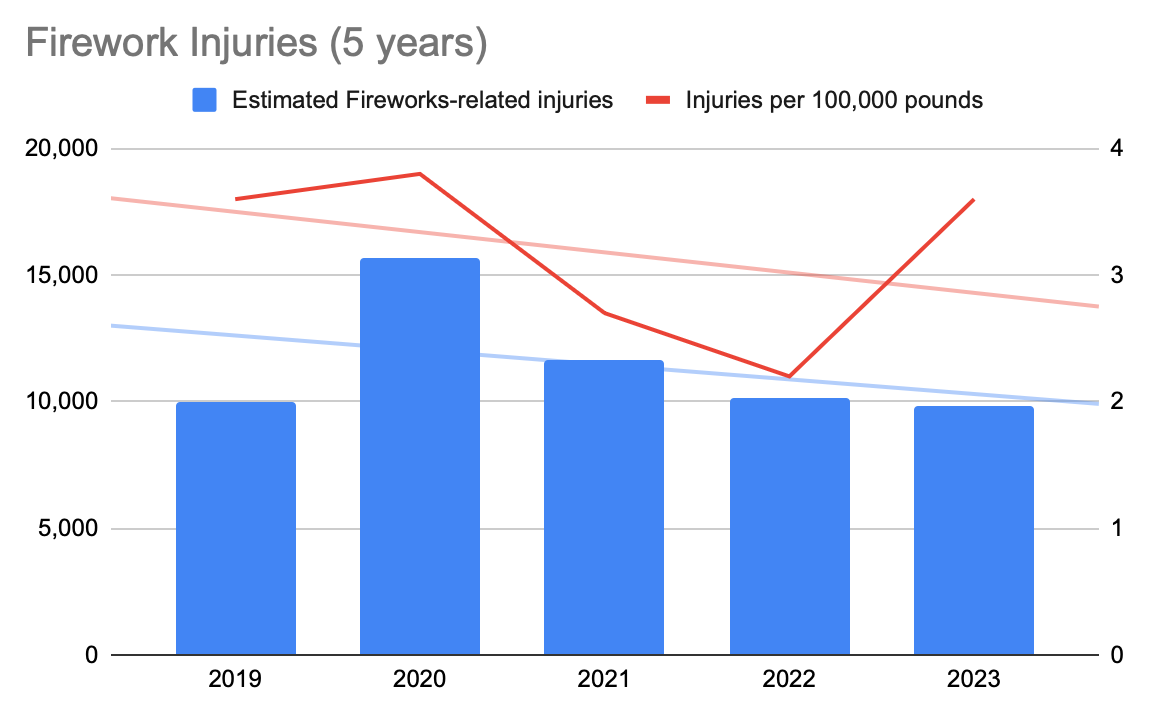
If you zoom in even further to the last 5 years, the trends look amazing! But I only share this to emphasize the point that graphs are helpful in context.
Context and Summary
These are all my opinions. Take them as you will.
According to the National Safety Council, the US has about 63 million injuries per year, or 172,602 per day. 10,000–12,000 injuries for roughly two days a year is not astronomical. These are all preventable injuries, and some can be server, but on those two days, more injuries happen outside of fireworks than because of fireworks. So this seems like a weak argument.
I didn’t analyze the environmental impact of consumer fireworks, so I’ll withhold an opinion on that, outside of saying that any fireworks leading to wildfires is terrible. And by anecdotal evidence, firework related wildfires mostly seem to be started by irresponsible male teenagers. Maybe an 18 year old minimum would be helpful for explosives.
Two of the primary reasons cited in the article were noise and air pollution, particularly for large displays that an entire city could hear. And I would argue that in the firework industry, Display fireworks are such a small portion of revenue that it’s probably not a big deal if those declined and shifted elsewhere.
Business Lessons Learned
BE SAFE!! If you work in a manufacturing, construction, warehouse, or similar industrial type of environment, safety should always be the #1 goal throughout your entire operation. Don’t compromise safety for numbers, ever.
Consumer trends change. Using Drones (as Outside Online recommends) might be the answer for a growing population of people who don’t want fireworks. It’s ok to embrace new things.
Context is everything. Looking at 47 years of injury data looks incredible. Massive strides in safety. Looking at 5 years says it’s even better. But looking at 20 years of safety data, it seems much more balanced. Good in some places, bad in others. It’s important to look at your data in different ways.
— — — — — — — — — — — — —— — — — — — — — — — — — — — — — — — — — — —
ANAF is a fun insightful series brought to you by WIPP Data, a Data Agency providing Fractional Data Science for Supply Chain Teams, and beyond.
Sources:
https://www.americanpyro.com/industry-facts-figures
https://www.valuepenguin.com/who-uses-most-fireworks-united-states#Which

Leave a comment