US National Parks are a treasure. They’re beautiful. Majestic. And I’m grateful of all the work that goes into building and maintaining these parks each year. 2016 was the 100 year anniversary and the entire Parks System made a huge effort to improve visitation through various marketing campaigns. Was that effort successful?
Are people going to parks more or less?
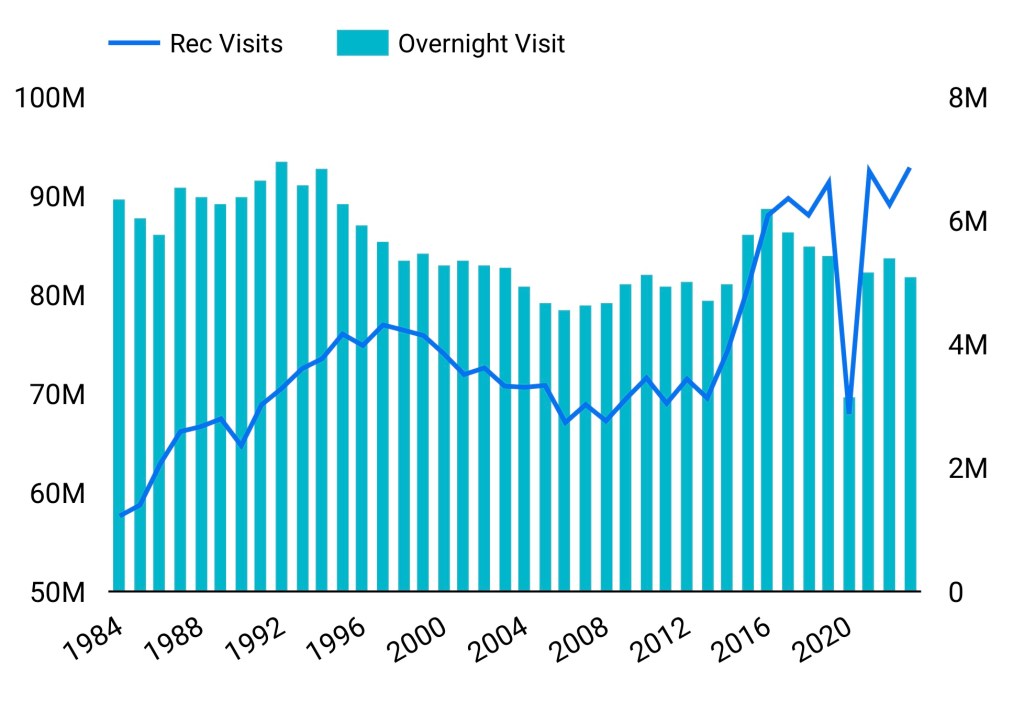
From 1984 until 2000, there was growth in both recreational and overnight visits. However, from 2001 until 2013, the numbers for recreational visits were also extremely flat. From 2014-2016, there is a noticeable increase. But while recreational visits have continued to increase, overnight visits are still on a decreasing trend.
One other thing to note is that the national parks have clearly rebounded from Covid. 2023 was an all time high for visits to the National Parks.
How does this compare to the population?
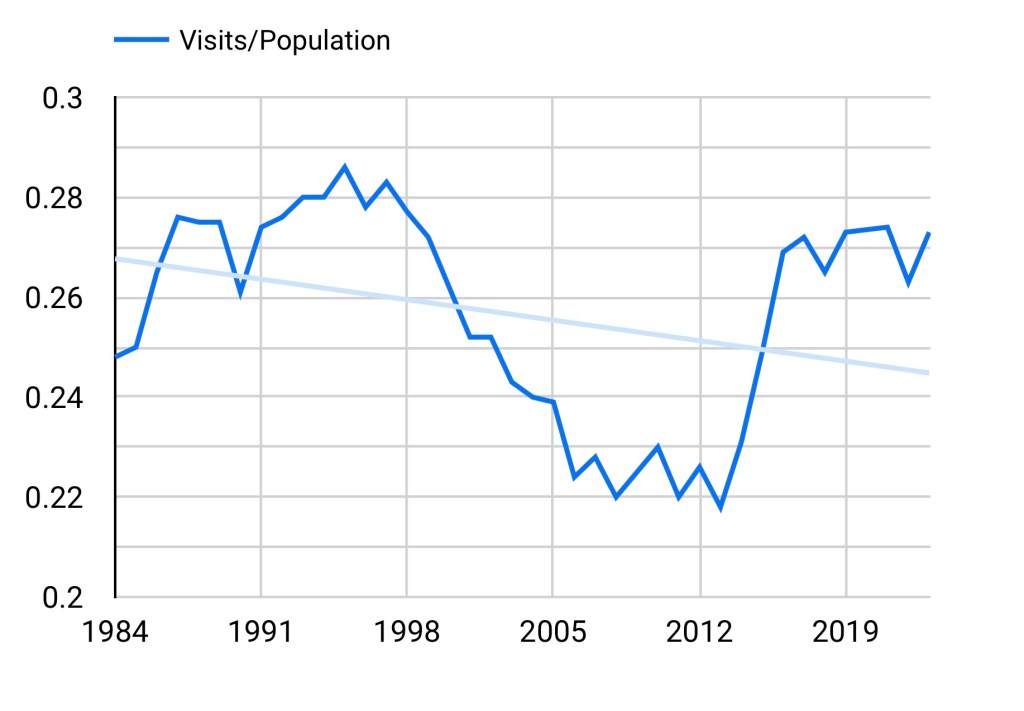
When compared to the US population (and excluding 2020), the trend is a lot more drastic. Nobody is going to the parks! However, there are two problems with looking at the numbers this way.
It’s not clear how many visitors are US or International. You couldn’t reasonably suggest that Americans are going to parks less, which makes this chart interesting but not informative.
Second, National Parks represent a finite resource. Sure, there are ways to get more people through Yellowstone. But there’s a balance here between preservation and tourism.
Which parks are growing the most?
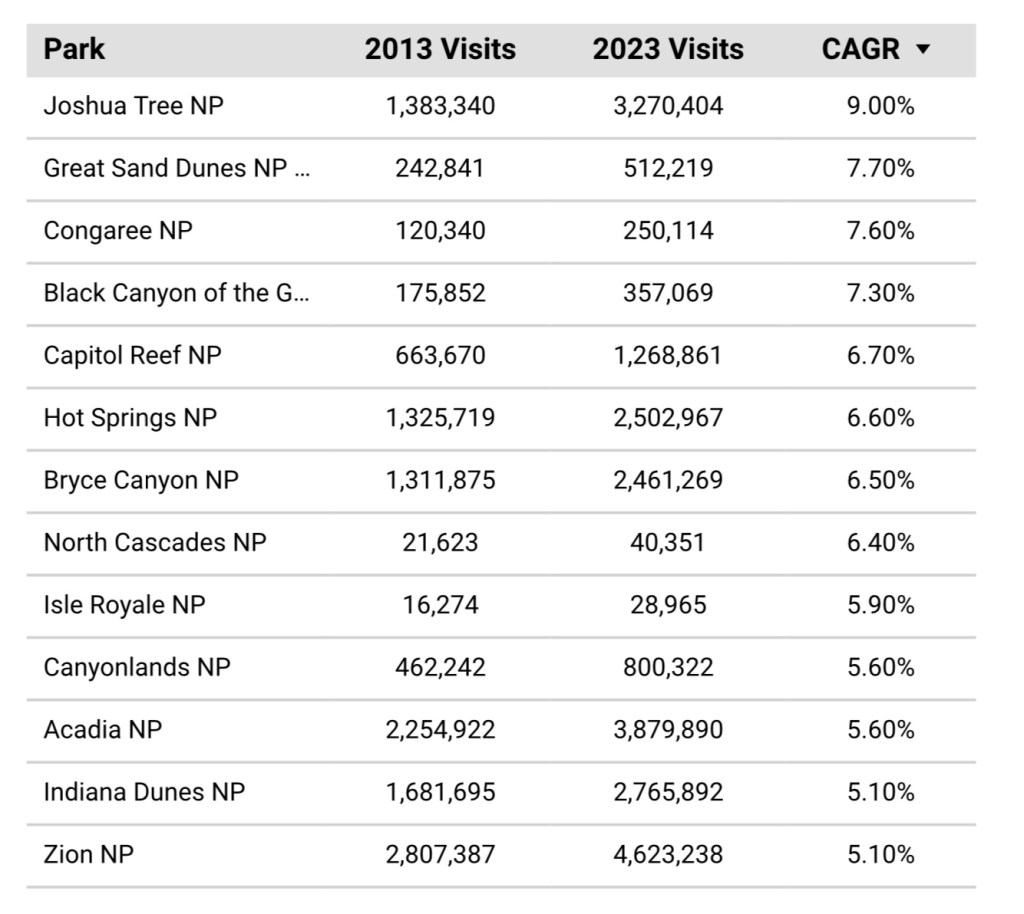
CAGR (Compound Annual Growth Rate) represents an annual average of visitation change.
Utah is having tremendous growth with three parks (Zion, Capitol Reef, and Bryce Canyon) growing 5% or more every year.
But part of the fun of national parks is to not go where there are no crowds. So go check out Congaree in South Carolina, Great Sand Dunes in Colorado, or North Cascades in Washington, which are all clearly popular, but aren’t entertaining millions of guests each year.
Conclusions and Possibilities
I love national parks. It’s great to be in nature. To explore. To see things that can only be found in one place on earth. While there are thousands of beautiful places on earth, each one is unique.
1. I would say that the 2016 Centennial Marketing campaigns were extraordinary. It’s clear that visitation numbers are up. The overall CAGR across all national parks is 2.9%. And this is just national parks. There was also a huge surge in visitation across National Monuments, Historical Sites, and much more.
2. The success was wide ranging. Out of 63 national parks, only 7 have fewer visitors in 2023 than 2013. That means nearly 89% of parks are increasing visitors. This highlights the success of the program in not just getting more people to the Grand Canyon. But rather, increasing overall interest in the park system.
3. While it doesn’t specify here, I’m guessing that there’s a lot of repeat visitors. People who had mild or medium interest in the parks all of a sudden reached high interest and went to multiple. One during spring break and a few during the summer.
Business Lessons Learned
Spend time coming up with the right solution. The park system started to plan their centennial events in 2008. This probably took a little too long, but if it’s a big enough challenge and opportunity, spend the time to get it right.
Look for helpful metrics, not interesting ones. Visits per Person is interesting, but doesn’t really give me any helpful information since visitors are international and capacity is constrained.
ANAF is a fun insightful series brought to you by WIPP Data, a Data Agency bringing you custom data solutions for any business.
Learn More
Email Us
Book an Appointment
Data Source: National Park System. Population Data: MacroTrends.

Leave a comment